SUB Dashboard
Set concrete goals and make your sustainable ambitions measurable and demonstrable in the Dashboard. Results are easy to share with customers, employees and stakeholders.

Behoud focus & rapporteer resultaten
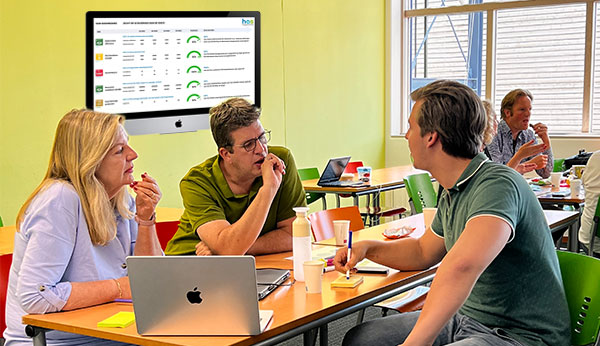
Targets (KPIs) help you focus. You can see in a concrete overview how you are doing and immediately know if you need to adjust. Results are easy to process in reports and presentations.
What can you do with the Dashboard?
Creating targets
Add sustainable targets (KPIs) and decide on the measurement moments, per year or per quarter. Select formulas to calculate growth or reduction.
Celebrate your achievements
Report on the progress you make with a single touch of a button. You get insightful visuals that you can download and share.
Linking to the SDGs
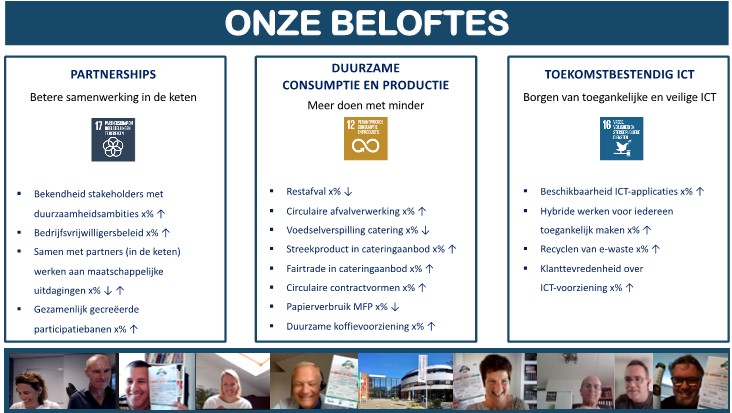
The Sustainable Development Goals were created to make the world a better place. How is your organisation contributing to this?
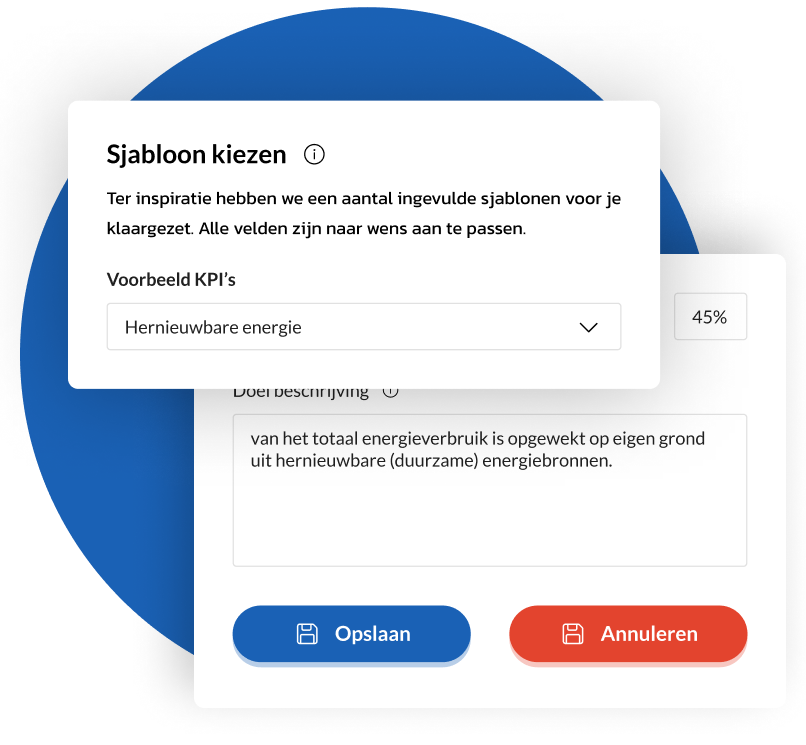
Use the sample templates
Several sample KPIs for inspiration. You can use and customise these templates for your own goals. Create your first goal:


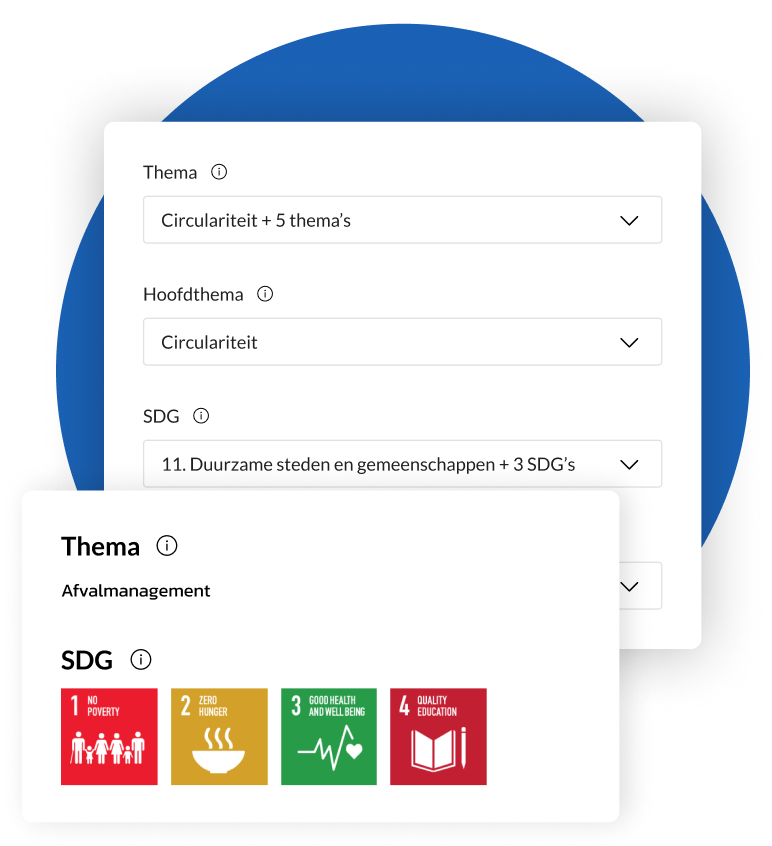
Link themes and SDGs to your goals
What sustainable themes do your goals intersect with? Waste management, awareness or health? For each KPI, you select themes and focus SDGs that you will later see in the overview of your Dashboard.
The benefits of the Dashboard
- From action plan to results
- Concrete targets (KPIs)
- Easy collaboration
- Clearly presented
- You decide when to fill in
- Linked to the SDGs
- Ensures focus
- For presentations and reports
- Sample templates included

Raising awareness

Make it visible
Frequently asked questions
It starts with thinking about and setting goals: What do you want to achieve with your company or organisation in four years' time? Is it about growth or reduction of a certain outcome? For example: Museum Greenworld wants 75% of the dishes in its eatery to be vegetarian in 4 years' time. Depending on the number of entry points you select, you enter data and monitor the progress of this ambition quarterly or annually via the SUB Dashboard. Data collected by Green World for this KPI is, for example, the number of vegetarian dishes from the eatery. Useful in the SUB Dashboard is that you can choose from various templates for inspiration for your own KPIs.
Many companies and organisations have sustainable ambitions, but are not so sure how to make them measurable and demonstrable. If this is something you are also struggling with, the SUB Dashboard will certainly help you. The goals (KPIs) you create are linked directly to data and formulas. For example: In 4 years, you want to reduce the number of kilograms of plastic waste in the office by 50%. Or the entire building should only be heated with solar energy in 4 years' time. In the SUB Dashboard, you periodically measure progress: are you on track or do you need to make adjustments? When you decide to communicate results to stakeholders, you download a beautifully designed visual that you can share immediately at the push of a button.
There are 30+ sustainability topics. Think waste management, cultural diversity, social impact and legislation. When you create a goal, you link various themes to it. There are also the Sustainable Development Goals: Which SDGs does your company or organisation want to contribute to? The themes and SDGs you select are shown in the SUB Dashboard overview.
Don't worry, we'll show you. The first step is a account create on the SUB Platform. Having done that, start the free trial. In the trial, you have 14 days of free access to all tools, including the SUB Dashboard. In the tool, we show you step by step how to create KPIs and how to measure them over X number of years. Fill in all the fields yourself or choose a template and customise it. If you can't quite figure it out, our support team is here to help.
By communicating regularly about your company or organisation's sustainable goals and how you are committed to them, you increase engagement among employees and external stakeholders. Of course, the way you communicate helps in the enthusiasm with which the message is received. Instead of a dull Excel document, we developed a nice visual that clearly displays all data. You can use the visual for reports, but also for a newsletter or social media messages.


